Management Reports
All Assets
This report summarizes all assets currently being tracked by TrackAbout and can be filtered by location. The default location will be the home location of the user logged in to the website.
The report output provides information about the number of assets, by Product Code and includes quantities:
-
In-House
-
Out at Customer
-
Marked Lost
-
Total
-
Dock Stock (The percentage of inventory of a particular product on "Dock", available for use)
Asset Type Changes
This report helps you find assets that have been mistakenly changed to the wrong Asset Type, and commonly happens due to user error.
Take a look through the results. If you see Asset Type changes that do not make sense, view the asset history and the record to research the problem.
Please contact your TrackAbout representative if you find problems that you are unable to fix.
Audits to Delivery Records
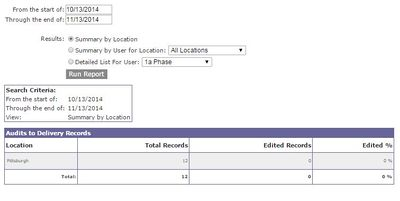
When a record is edited, an audit entry is created and associated with the record. This audit entry indicates who edited the record, when, and what they changed. It might also include some comments written by the user who edited the record. This report shows statistics regarding the number of user-created records that required editing and would identify users who might make mistakes on deliveries or who might need more training.

Output can be based on:
-
Summary by Location
-
Summary of users by Location
-
Detailed list by User.
Customer Deliveries
This report shows statistics on deliveries made during a period of time well as statistics about the delivered and returned asset counts for these deliveries. You might use this report to find customers with frequent small deliveries that really should get less frequent larger deliveries. You might also use this report to find customers that are returning more assets than they are being delivered. These are customers that may be about to switch to a different distributor.
The report can be limited to deliveries from a single location. This is the location from which the delivery originated. not necessarily the assigned location of the person that made the delivery.
If a customer receives deliveries from multiple locations, then "All Locations" must be selected for this report to give a complete picture of this customer's activity.
You have the option to exclude Exchange Type assets from the delivered and returned counts so that these assets do not clutter the more important information for more valuable assets. Setting an asset type as an Exchange Type is done from the TrackAbout Config / Asset Classifications page.
The Net Change column equals the Delivered Assets minus the Returned Assets.
The Average Delivered column equals the Delivered Assets divided by the Deliveries.
Expiring Assets
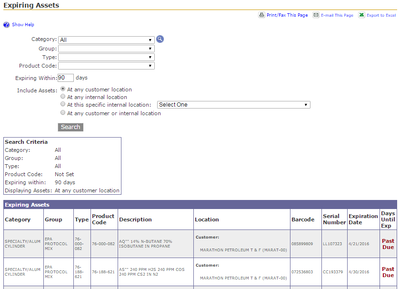
Search for assets that are in use and are either expired or about to expire. TrackAbout has several ways to monitor expiration.
In the case of the Expiring Assets report, for clients using TrackAbout Mobile 6, Expiration Date is based on manual entry during Receive from Vendor action or during the Set Expiration Date mobile action.

Filled vs. Delivered
This report compares the quantity of filled assets to delivered assets over a given time period.
Lost Assets
As a result of Customer Audits or Accounting investigations, assets maybe marked as "Lost" on the website. This will remove the asset from the branch's inventory, but the cylinder's information will still be maintained in the TrackAbout database. In the report, the 'Lost Location' column will display the last known location of the asset. If a customer is responsible for the asset, it will be listed in the 'Responsible Customer' column. The columns can be sorted by clicking on the column headers. To perform a secondary sort, hold  while clicking on the second column.
Movement Between Locations
This report shows assets that have been moved between locations. The three parameters it accepts are: the origin (From) location, the destination (To) location and a date range. This report can be viewed as a summary by Category Group and Type, or as a detailed report by record.
NOTE
This report only counts items that go directly between the From and To locations, meaning that if there is a third location (even if that location is a truck) between them it will not be counted.
New Assets Added
Find assets added to the system for a given period of time. Report can be filtered by category, group, type, asset family, and ownership.
There are three types of newly added assets:
-
Include new company-owned assets (exchange and non-exchange) and third-party exchange asset types: Will return all assets added matching the search criteria that are owned by the company, regardless of exchange type. It will also include third party assets with an asset type marked as exchange.
-
Include third party non-exchange asset types: Will return new non company owned assets with an asset type not marked as exchange.
-
Include assets on receive from vendor actions from supplier locations: Will return third party assets with non-exchange asset types that were previously at a location of type 'Supplier' and are now at a non-Supplier location.
You NEED to check at least one box for the report to run. The best practice is to always check all three boxes to override automatic filtering.
Production Record
This report provides you with a complete view of your production pipeline including display of Pre-Fill Inspections and Post-Fill Analysis.
The report can be filtered either by lot number or by location and date, and any missing Pre-Fill Inspections and Post-Fill Analysis will be indicated.
Available configurations:
-
Include Assets Removed in Production Record - When set to True, the total assets count will include assets removed from the lot. When set to false, the total assets count will have the number of assets removed from lot subtracted.
-
Number Of Days For Date Search Range On Production Record: - This setting indicates the maximum number of days to allow for a range when searching for lots on the production record page.
-
Show Throughput Statistics on Production Record: When this is set to True, Throughput Statistics will show on the Production Record report. Throughput statistic provide the number of cylinders that completed and action (i.e. Sort or Fill) / number of assets that were initially included in that action. For example if the Fill Throughput Stat is 8/10 is indicates 10 cylinders were originally included in the Fill action but 2 were removed from the Lot.
Scanning Scorecard
The scanning scorecard helps track locations' or users' performance over time. The scorecard can be viewed for up to 31 days at a time. If you click "View Scorecard" for all locations, clicking on an individual location will allow you to view user performance at that location.
Assets Filled (Serial Number)
Assets Filled (Serial Number) keeps track of the percentage of assets scanned during a fill that do not have a serial number. An exception to this is if the asset falls into the Asset Type + Ownership identified in the Serial Collection Rules. If the asset falls into one of these rules, then the asset will be counted as having a serial number, even if the asset does not actually have a serial number.
During a fill users should be prompted when an asset does not have a serial number. After filling, if the user then goes and adds the serial number to the asset, the scanning scorecard will be updated automatically to reflect this change. For example, if a user scans 10 assets and 1 asset does not have a serial number, the scanning scorecard will read 90%. Once the user adds the missing serial number to the asset, the scanning scorecard will be automatically updated to 100%. If adding the serial number to the asset creates a collision, the scanning scorecard will not be updated until the collision is resolved.
Assets Filled (No Exceptions)
Assets Filled (No Exceptions) keeps track of the percentage of assets scanned during a fill with exceptions. An "exception" means that there was an asset transfer exception when completing the fill. This means that there was an unexpected transfer or movement of an asset between customers or locations. For example, if Customer A has Asset 1234 on its balance, and you scan asset 1234 on a fill record at an internal location (a fill plant), Asset 1234 must be taken off of Customer A's balance and located to the fill plant. This creates an exception and counts against the Assets Filled (No Exceptions) scanning scorecard percentage.
Assets Delivered (Serial Number)
Assets Delivered (Serial Number) keeps track of the percentage of assets scanned during a delivery that do not have a serial number. An exception to this is if the asset falls into the Asset Type + Ownership identified in the Serial Collection Rules. If the asset falls into one of these rules, then the asset will be counted as having a serial number, even if the asset does not actually have a serial number.
After the delivery, if the user goes and adds the serial number to the asset, the scanning scorecard will be updated automatically to reflect this change. This functions similarly to the Assets Filled (Serial Number) column of this report.
Assets Delivered (Nonblank Lot Number)
Assets Delivered (Nonblank Lot Number) keeps track of the percentage of assets scanned during a delivery that do not have a lot number.
